


A significant 25% of internet traffic is currently generated by malicious bots, creating a major challenge for organizations struggling to differentiate between helpful and harmful bot activities. This exposure to potential security threats poses a serious concern.
While beneficial bots expedite business processes, malicious ones cause data theft and service disruptions. Detecting and preventing bad bot attacks is crucial for safeguarding against these threats. However, blocking these malicious bots is complex, as they constantly evolve, mimicking human behavior to bypass security measures.
To protect web applications, organizations need a dedicated, sophisticated tool capable of analyzing incoming traffic, distinguishing between genuine users, beneficial bots, and even advanced malevolent bots.
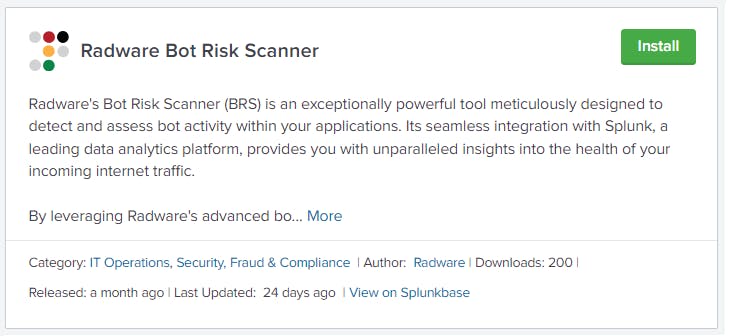
Radware's Free Bot Risk Scanner
Radware's Bot Risk Scanner (BRS) is a freemium tool exclusively for Splunk, identifying bots through SIEM data. By analyzing incoming traffic, it provides valuable insights into traffic patterns, aiding informed decisions to safeguard applications. BRS, as a monitor-only service, integrates with SIEM logs in Splunk, categorizing incoming traffic as human or bot using Radware's comprehensive bot intelligence.
Reason to opt Radware Bot Risk Scanner
Businesses often detect attacks only after they've happened, especially when bot masters use stealthy, low and slow attack techniques designed to evade detection. Identifying breaches or malicious activities from such attacks may take months.
Bot operators take advantage of major shopping events like Black Friday and Christmas, disguising their actions within legitimate human traffic. However, their intentions are malicious, aiming to harm businesses' reputations and customers through activities like identity theft, account takeover (ATO), scalping, scraping, and more.
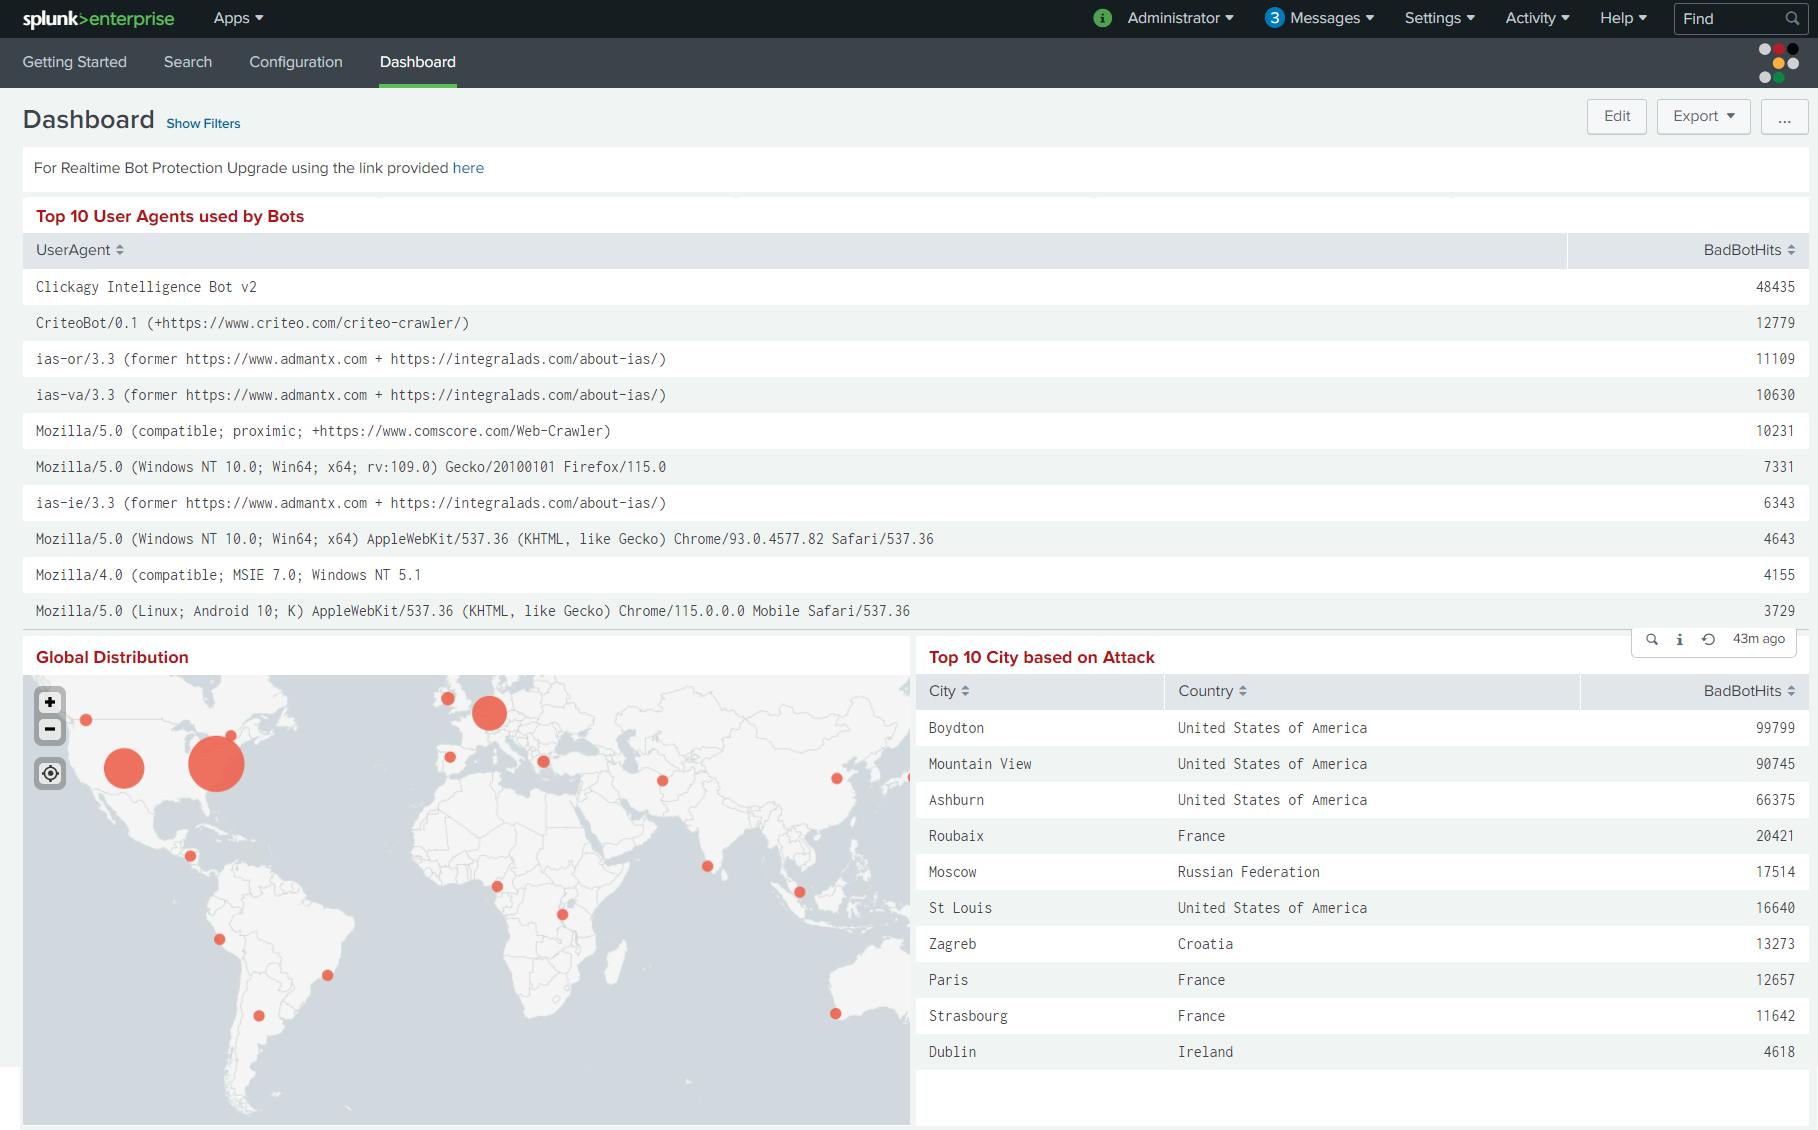
To proactively strengthen security, Radware's Bot Risk Scanner monitors incoming traffic through SIEM logs, enabling businesses to identify and counter malicious attacks. The Radware Bot Risk Scanner, integrated with Splunk, offers detailed insights through the Bot Risk dashboard, empowering effective threat mitigation.
Total requests to your application
Bad bot requests are detected hourly
Bot classification
Average attack duration
Crawler and aggregator stats
Origin of attack instances based on country, city, ISP and domain
Top user agents used by bots
URLs impacted by bot attacks
Referrer URLs used by bots, and
Attacks based on IP address
You can access all these features without any cost, as Radware Bot Risk Scanner provides them for up to 2 million incoming internet sessions per month at no charge. Moreover, there is no need for any additional integrations or modifications to your existing infrastructure to implement the Bot Risk Scanner effectively. This makes it an ideal solution for real-time traffic monitoring, enabling you to stay one step ahead of potential attackers effortlessly.
How to Install Radware Bot Risk Scanner
First, you’ll need to have a Splunk Enterprise or Splunk Cloud account. Then simply install the Radware Bot Risk Scanner app from Splunk and follow the integration guidelines.
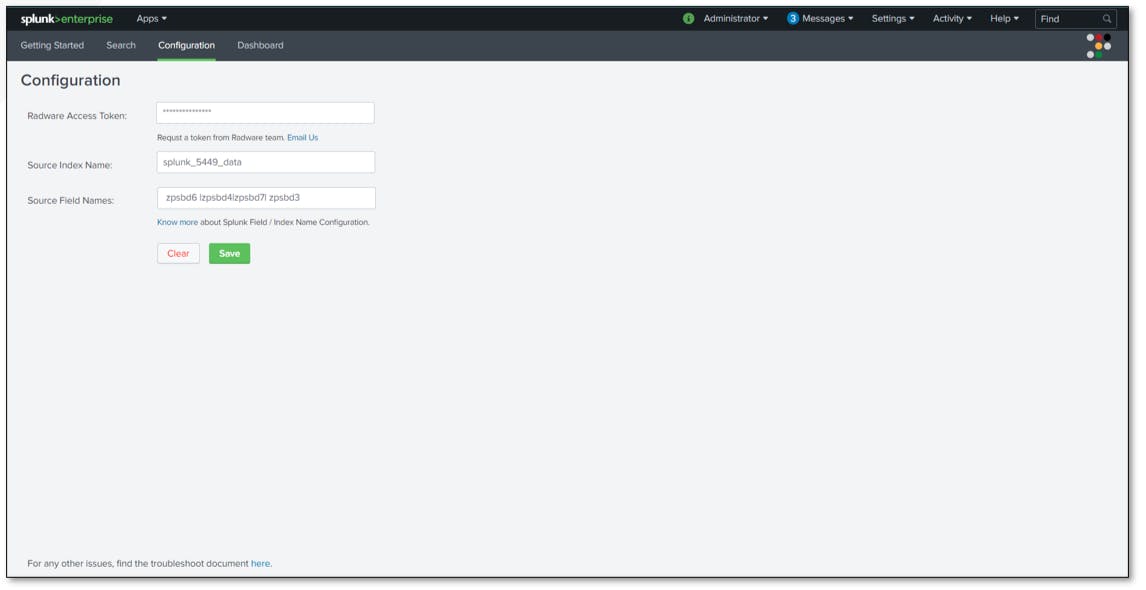
Go to the configuration page to set up BRS by providing 3 things
Radware Access Token
Source Index Name
Source Field Name (Note- IP, URL, User Agent are required parameters whereas referrer is optional )
Dashboard & Visualizations
The dashboard provides the following visualizations and information:
Total Request: Total number of packets in the Source Index scanned.
Bot Requests: Total number of packets classified as bots (Includes Crawler and Aggregator).
Bot Signature Count: Total number of unique signatures created against bots (Includes Crawler and Aggregator).
Impacted URL’s: Total number of URL’s being impacted by Bot Attacks
Avg. Attack Duration | Top 10 IP's: Average time spent by top 10 IP Address while performing Bot attacks.
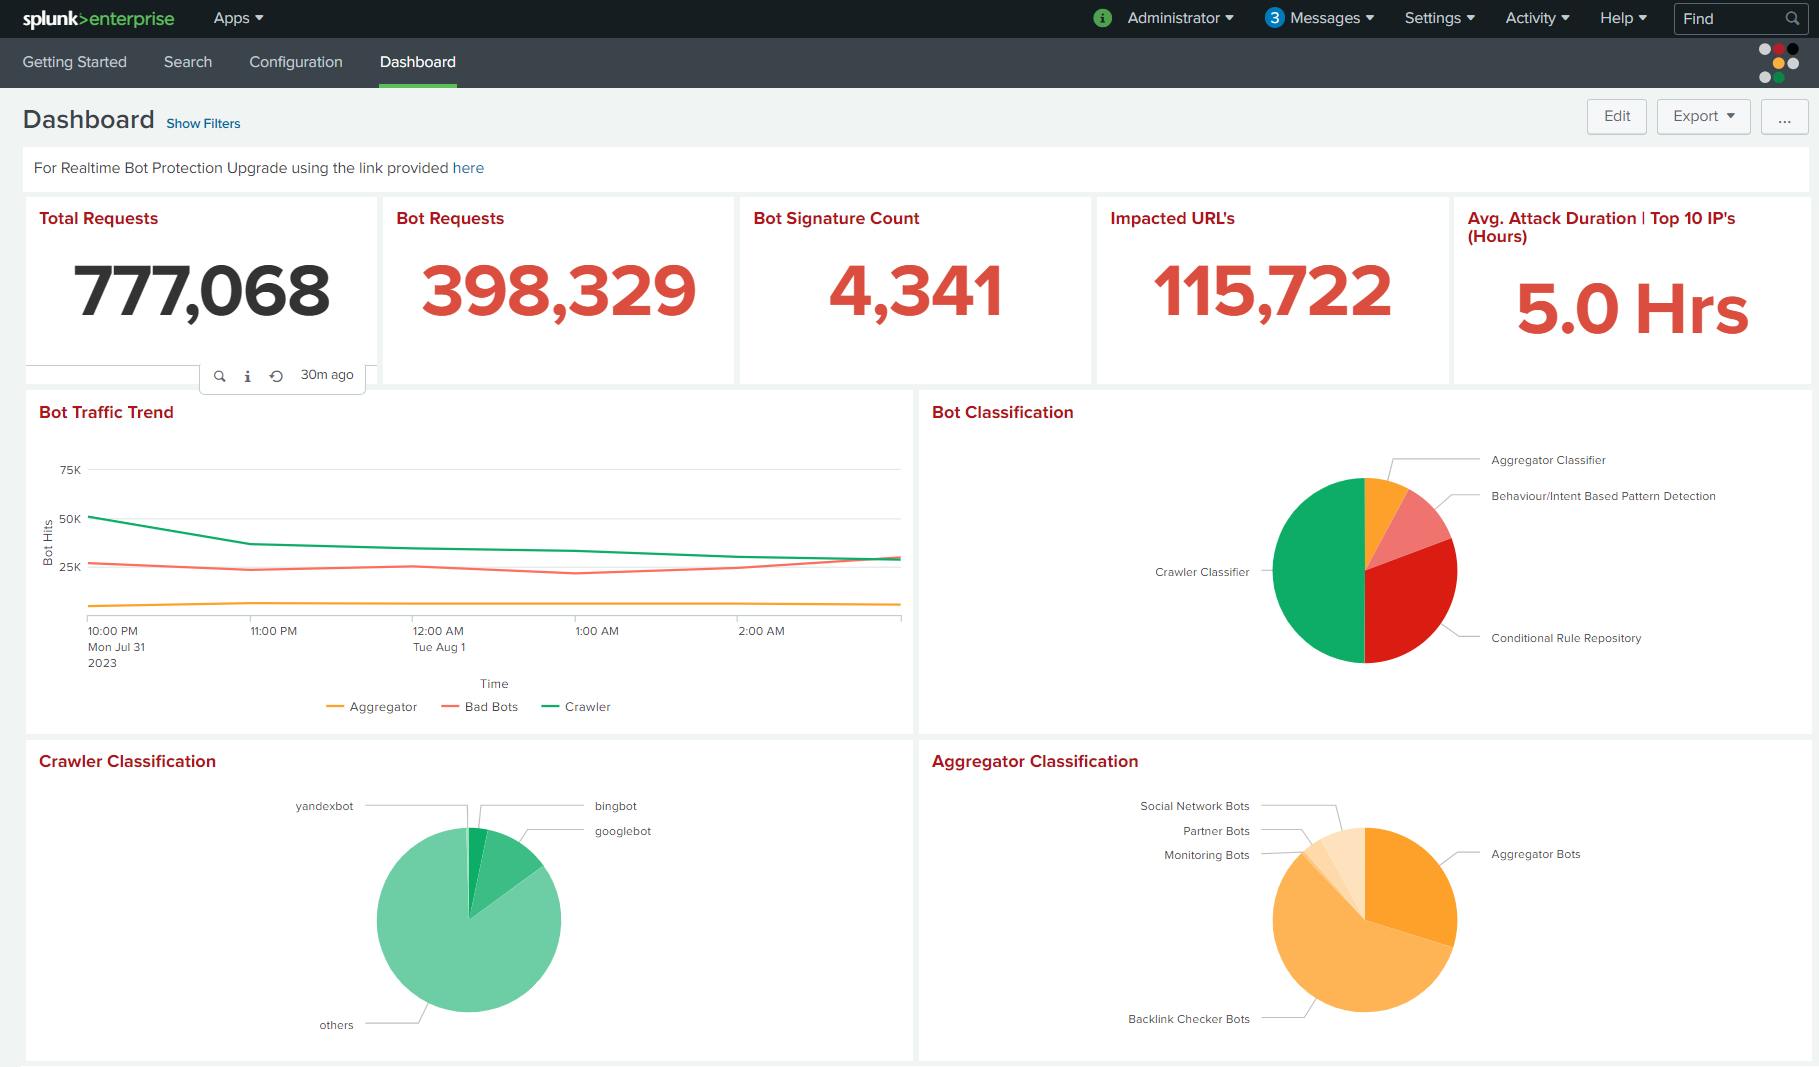
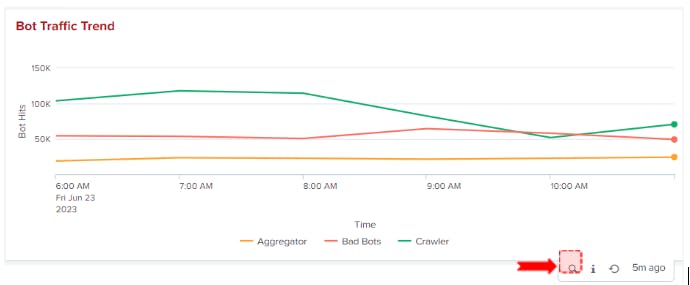
Bot Traffic Trend
Bot Classification
Crawler Stats
Aggregator Stats
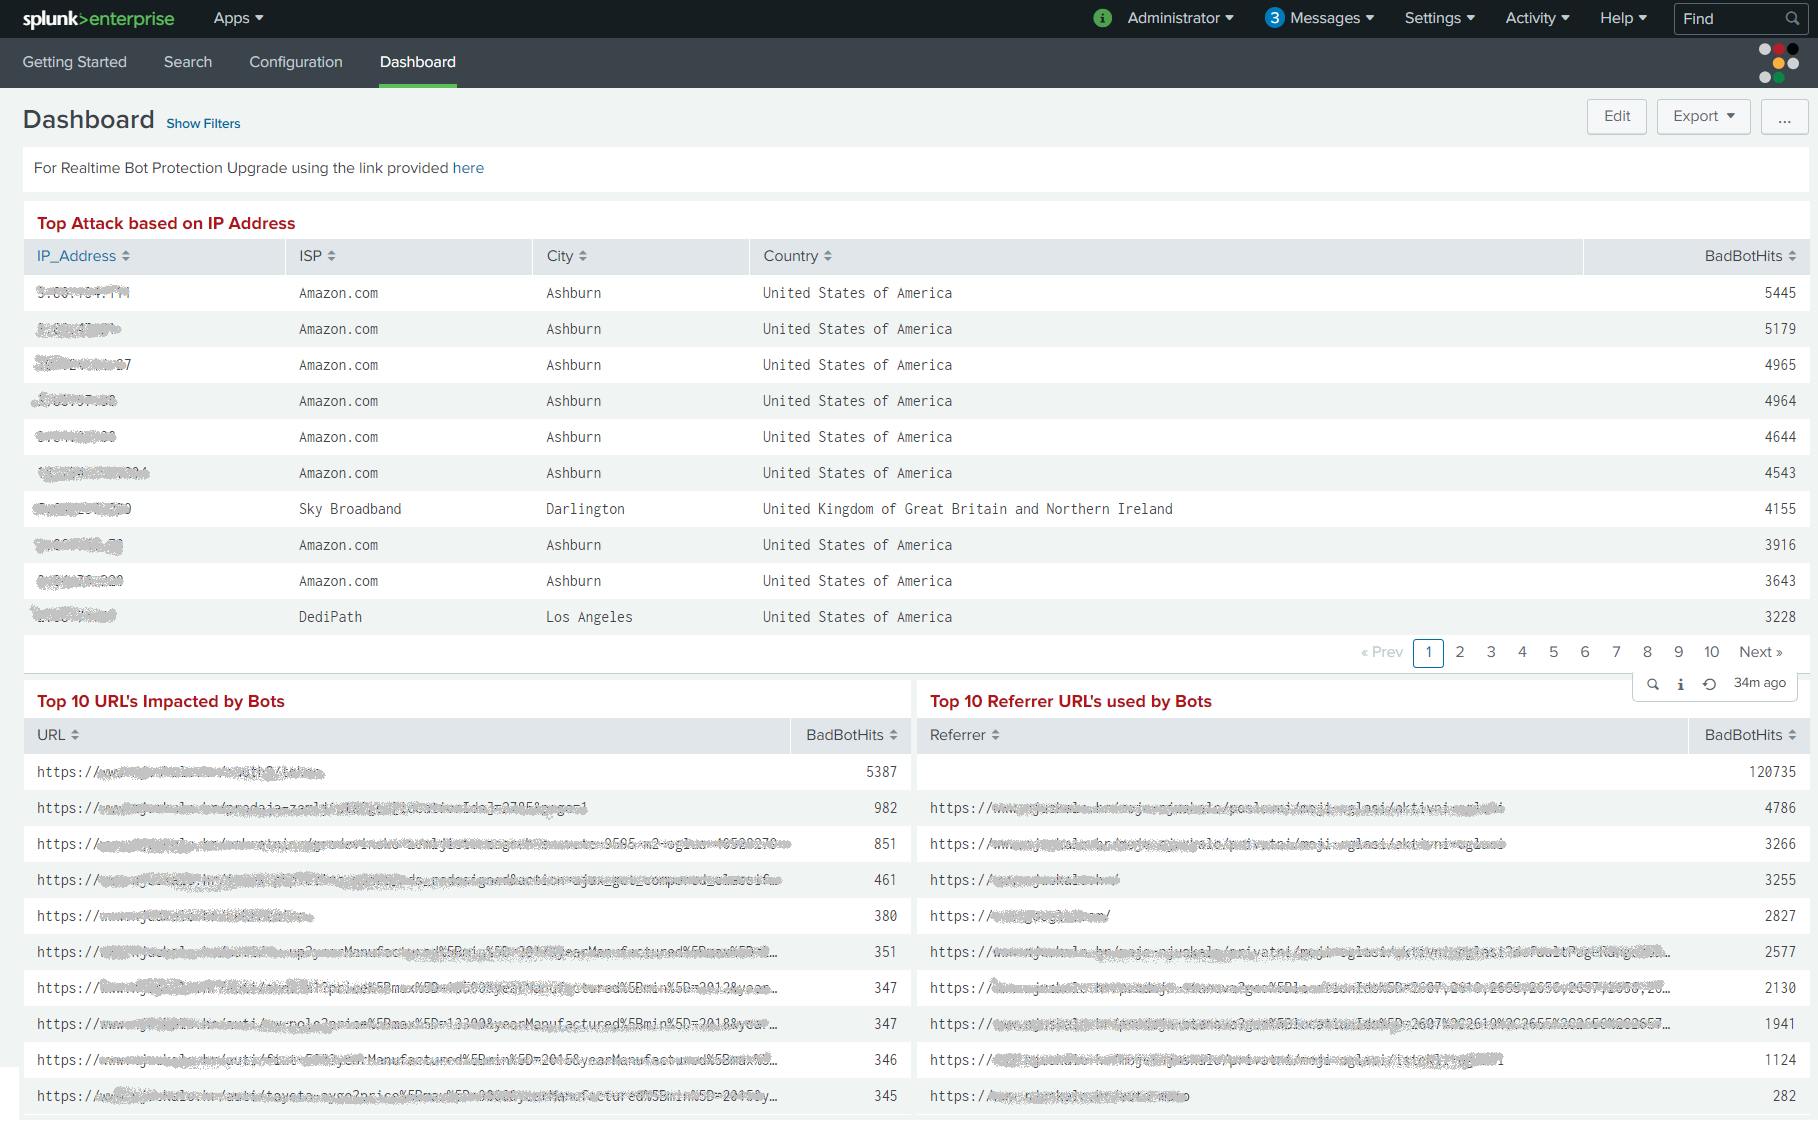
Top Attack based on IP Address: List of IP’s classified as Bad by Radware Bot Risk Scanner along with ISP, City, Country, and Total hits made by individual IP within the selected period.
Top 10 URL’s Impacted by Bots: List of the top 10 URL’s and the number of bad bot hits on each URL within the selected period.
Top 10 Referrer URL’s Impacted by Bots: List of top 10 referrers and the number of bad bot hits on each URL within the selected period.
Debugging & Limitation
Limit of 50k results for top command-
To handle this go to the limits.conf or in your instance in [$SPLUNK_HOME/etc/system/README/limits.conf.spec].
Modify / create the stanza as per your needs to process more data on any of these paths
$SPLUNK_HOME/etc/system/default/limits.conf
$SPLUNK_HOME/ /etc/apps/RadwareBotRiskScanner/default/limits.conf
Refresh after changing the Splunk configurations-
The /debug/refresh command in Splunk is used to force a refresh of Splunk configurations. This can be useful if you have made changes to your Splunk configuration and need to see the changes take effect immediately. The /debug/refresh URL can be used to troubleshoot Splunk configuration problems. However, it is not a substitute for proper configuration management practices and the command will not refresh data stored in Splunk indexes.
For example, if your Splunk server is named splunk and is running on port 8000, you would use the following URL: http://splunk:8000/en-US/debug/refresh